Common Issues and Fixes
98% of issues are resolved by clearing your browser cache. If that doesn't work, follow the debug instructions below.
Clear Your Browser Cache
Clearing your browser cache gives your browser a fresh start — it fixes loading issues and ensures you're seeing the most up-to-date version of Maestrow.
Google Chrome
- Click the three vertical dots (⋮) in the top-right corner.
- Select Clear Browsing Data (or press
Ctrl + Shift + Delon Windows /Cmd + Shift + Deleteon Mac). - Set the time range to All time.
- Check Cached images and files.
- Click Clear data.
You can uncheck "Cookies and other site data" if you don't want to be logged out of other websites.
Microsoft Edge
- Click the three horizontal dots (⋯) in the top-right corner.
- Go to Settings > Privacy, search, and services.
- Under Clear browsing data, click Choose what to clear.
- Set the time range to All time.
- Check Cached images and files.
- Click Clear now.
Safari (Mac)
Quick method
- In the menu bar, click History.
- Select Clear History at the bottom of the list.
- Choose All history and click Clear History.
This will also remove your cookies and browsing history.
Cache only (without clearing history)
- Click Safari in the menu bar, then Settings.
- Go to the Advanced tab and enable Show features for web developers.
- A Develop menu will appear in the menu bar — click it and select Empty Caches.
Mobile
- Chrome (iOS/Android): Tap the three dots > Settings > Privacy and Security > Clear Browsing Data.
- Safari (iPhone/iPad): Open Settings > Safari > Clear History and Website Data.
Advanced Troubleshooting with Debug Mode
If clearing the cache doesn't resolve your issue, Debug Mode lets our engineering team look under the hood of your browser to identify exactly where a problem is occurring. This is particularly useful for:
- Corporate security layers — Enterprise firewalls or security software can interact with web tools in unexpected ways.
- Browser compatibility — Older browser versions or specific configurations can prevent features from loading correctly.
- Localised errors — Some issues only occur on a specific machine or network.
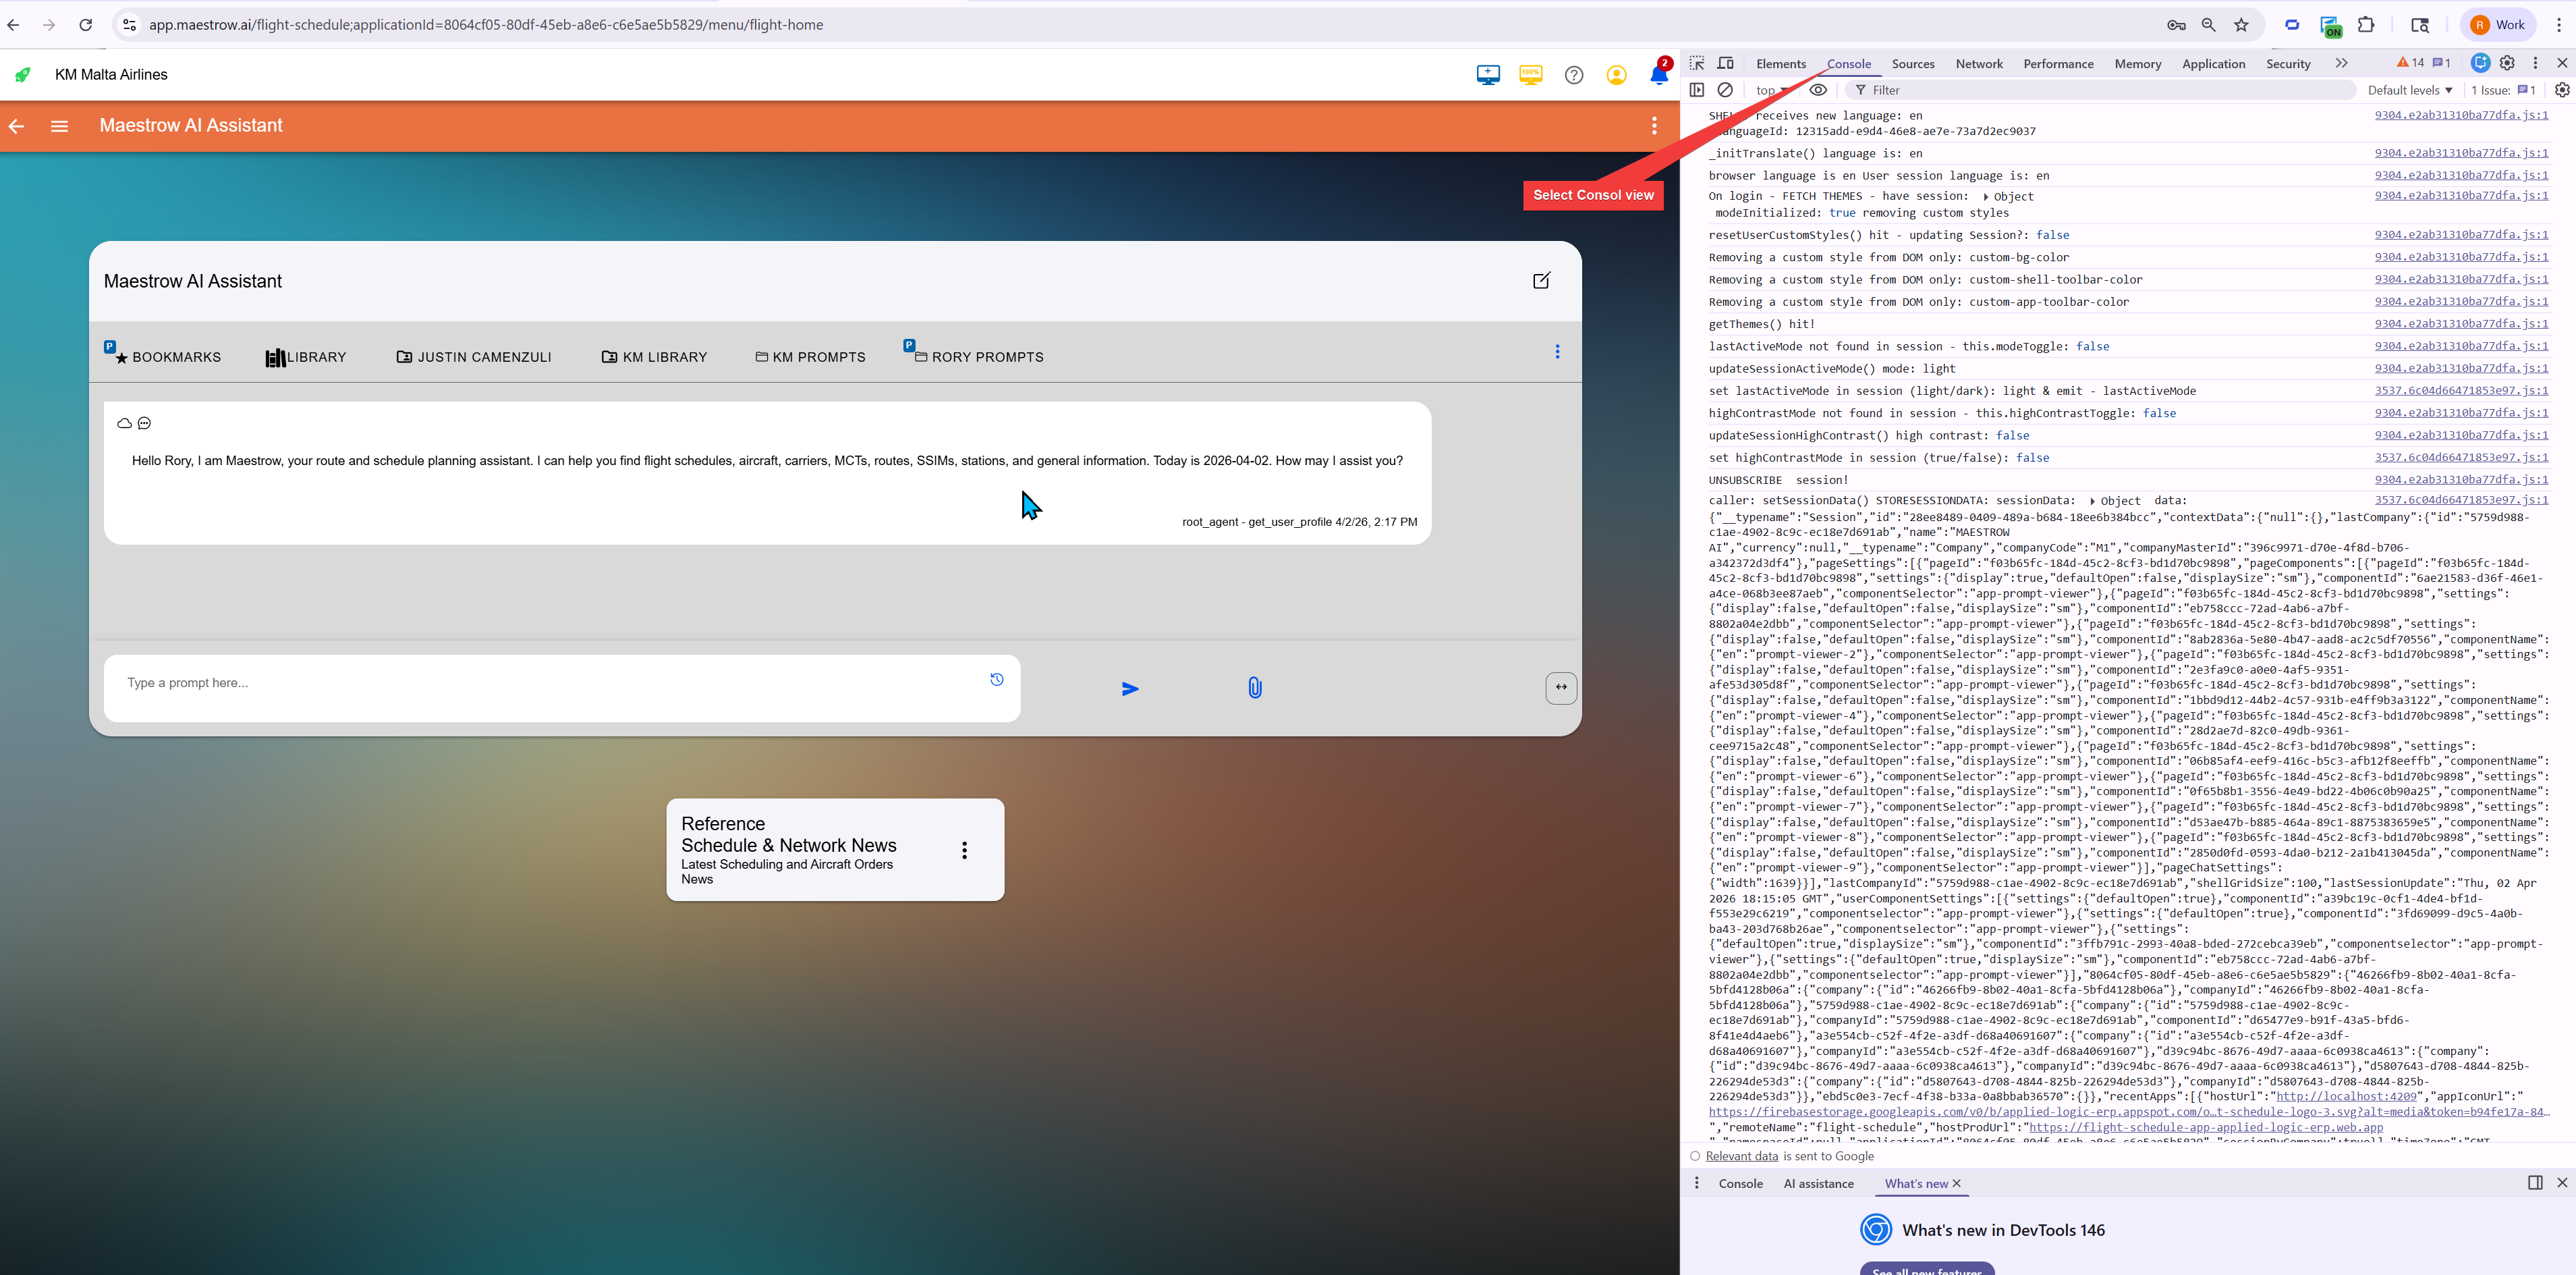
Opening Developer Tools
Windows — Press F12 or Ctrl + Shift + I in any major browser (Chrome, Edge, Firefox).
Mac — Press Option + Command + I in Chrome, Edge, or Firefox. To jump directly to the Console tab, press Option + Command + J.
After opening, your screen should look like this:
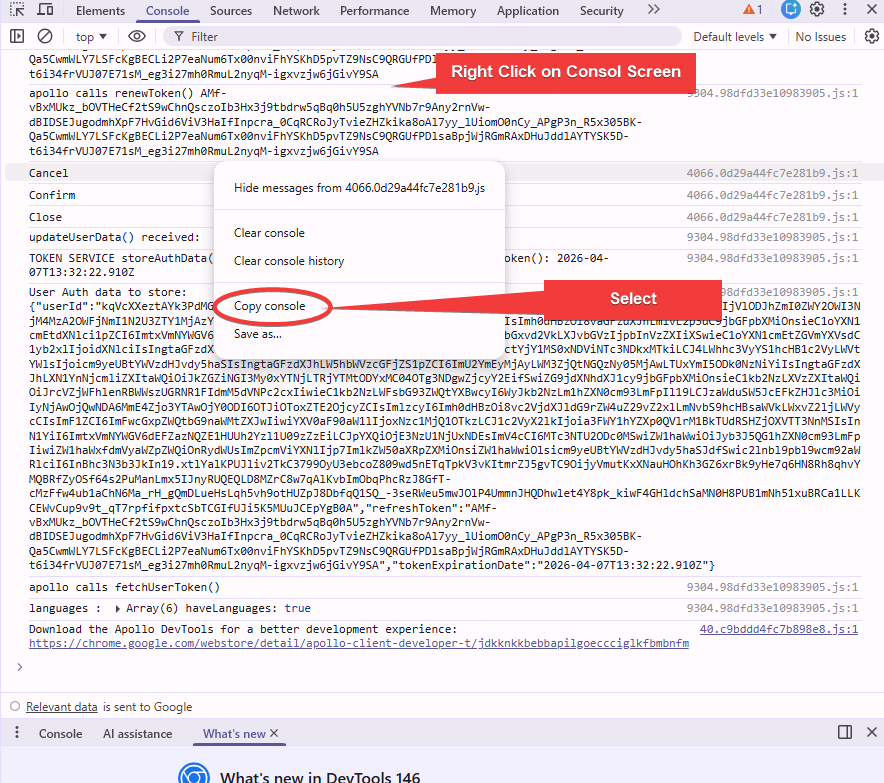
Sending Debug Information
Take a screenshot of the full console and email it to our support team, or copy and paste the console output directly.
Our engineering team can also guide you through this live over the phone if you prefer.